 |
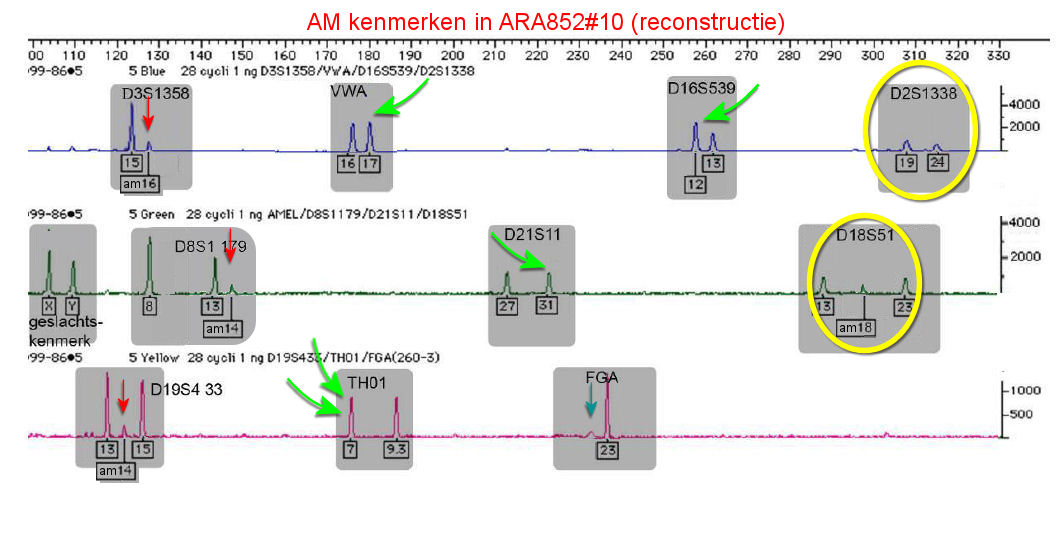
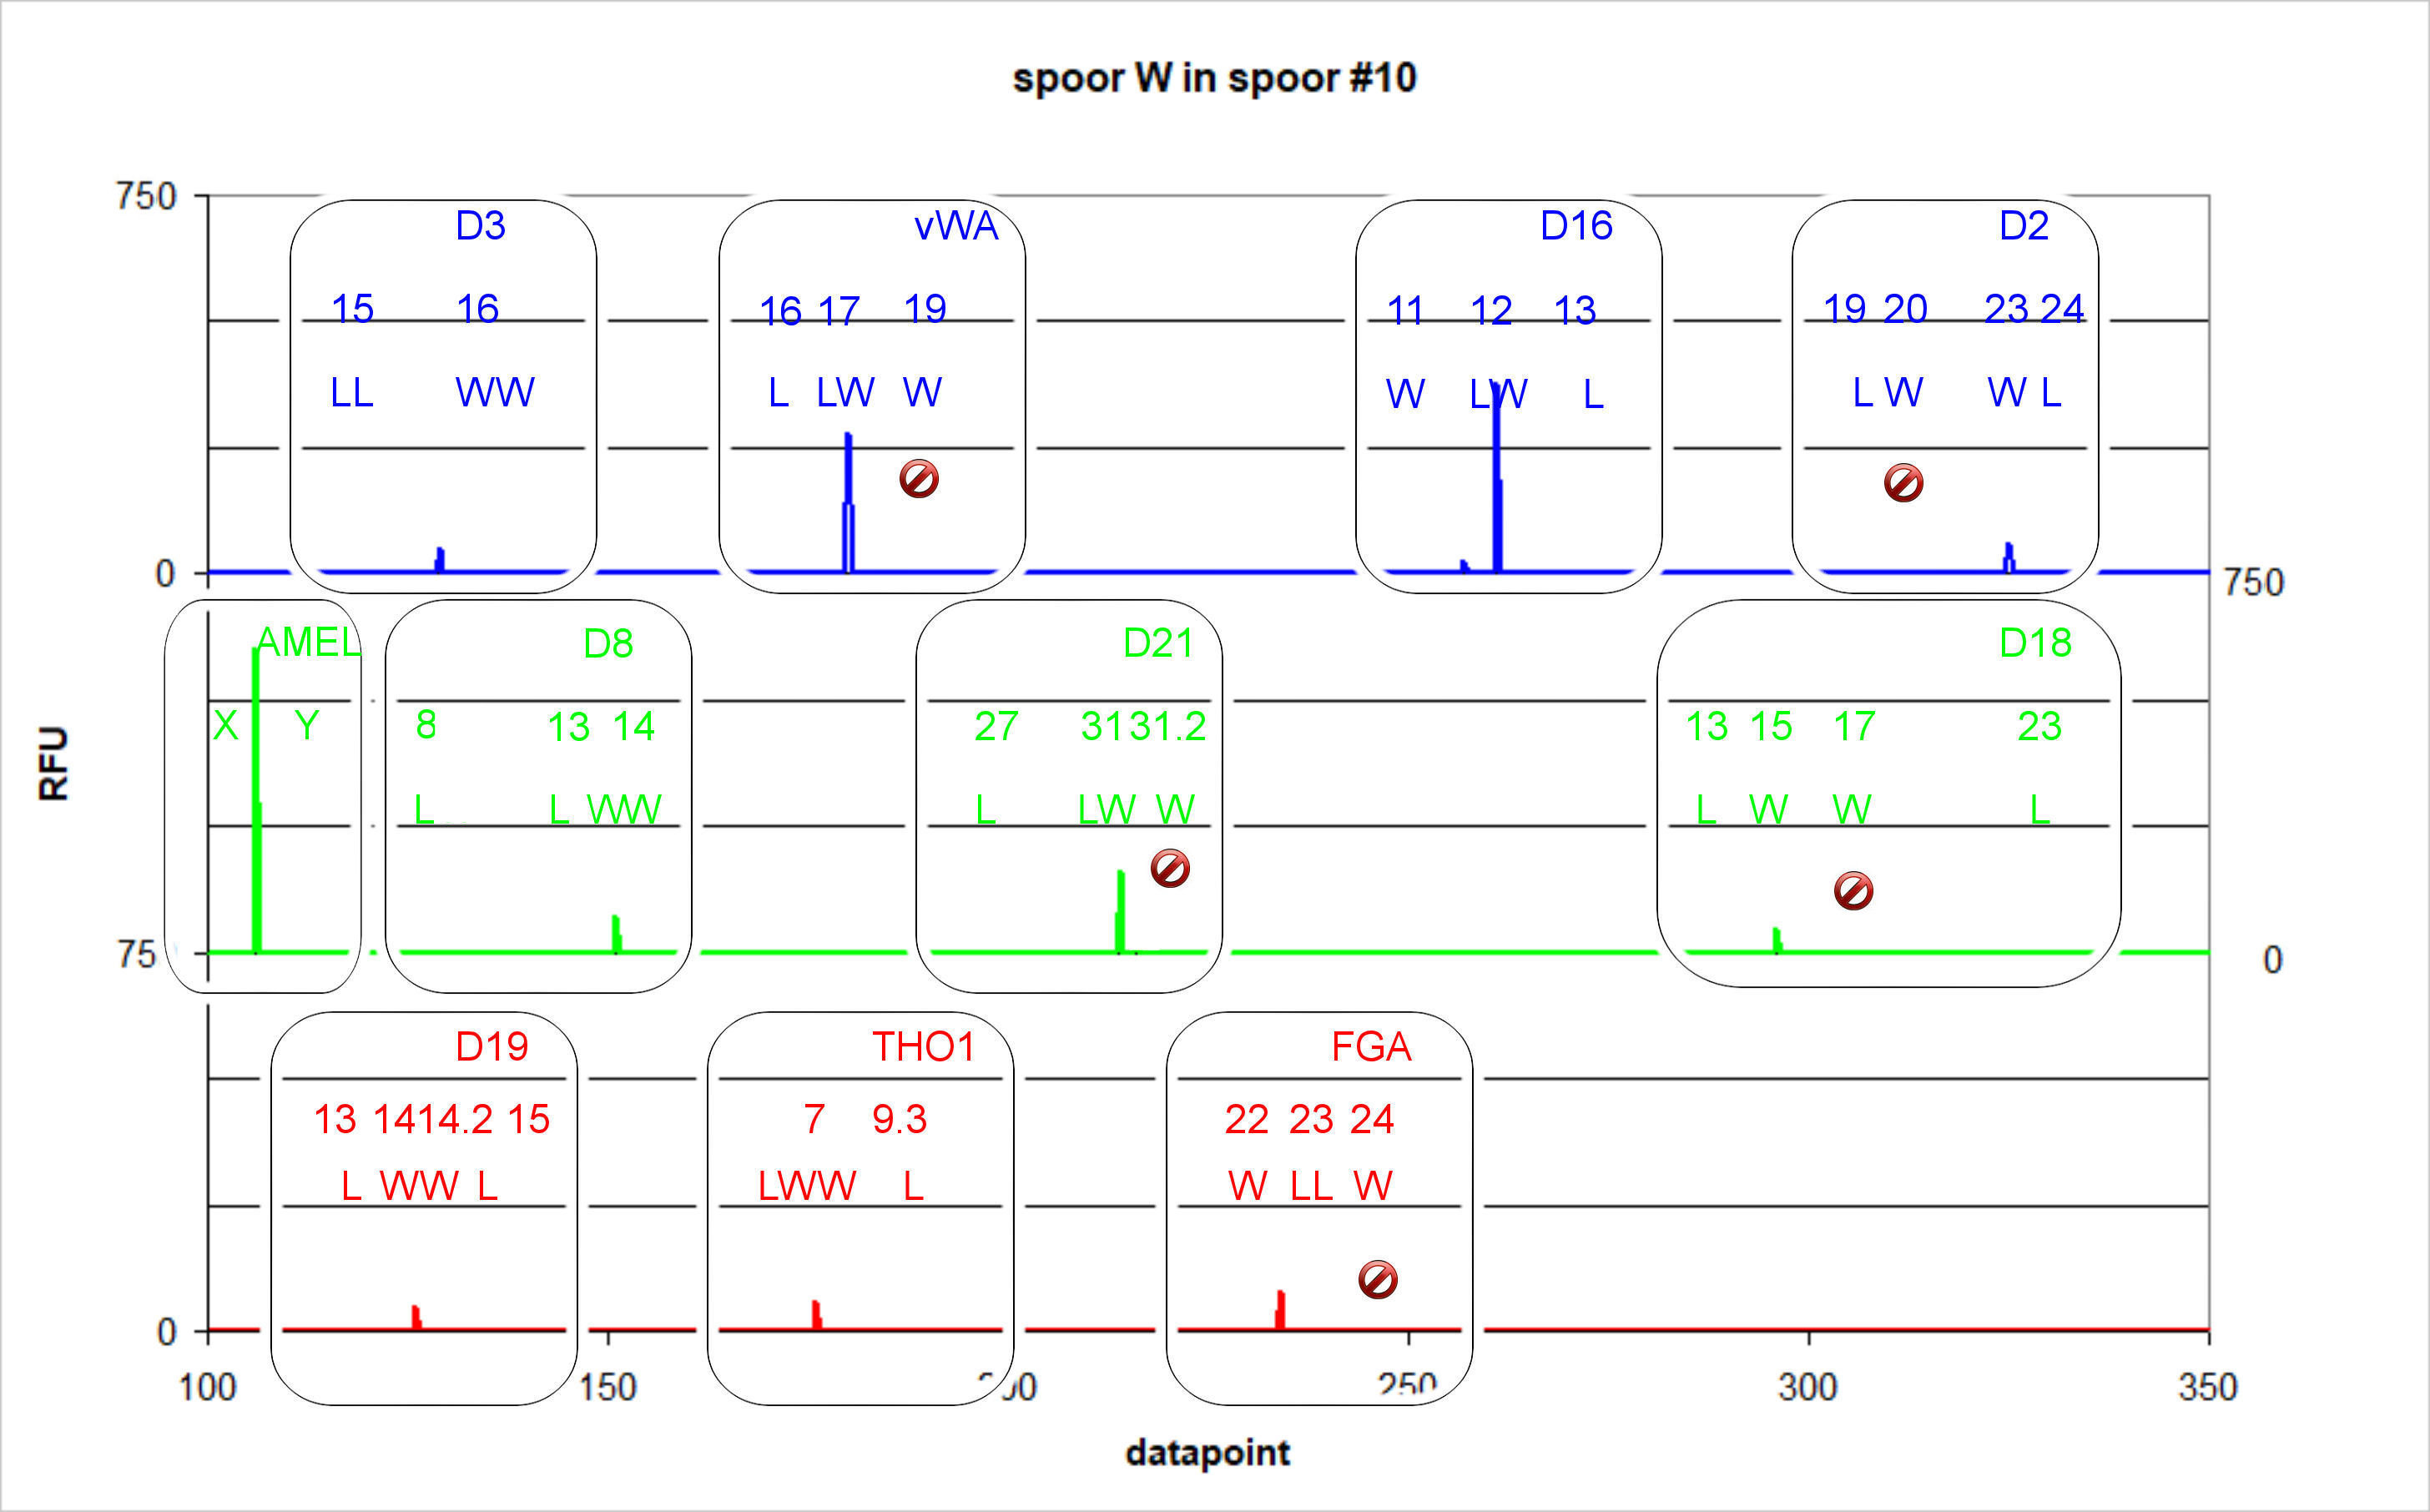
| This reconstruction of the electropherogram of trace #10 displaying 11 loci to be discussed below. |
A bit to much of a coincidence.
|
| This reconstruction of the electropherogram of trace #10 displaying 11 loci to be discussed below. |
Below all positions ('loci') in the reference buccal swab profile of Louwes are compared to the profile in trace #10.
|
Locus and references (zie
legenda below) |
referenceLouwes |
trace #10 |
comparisons |
|
D3 |
|
|
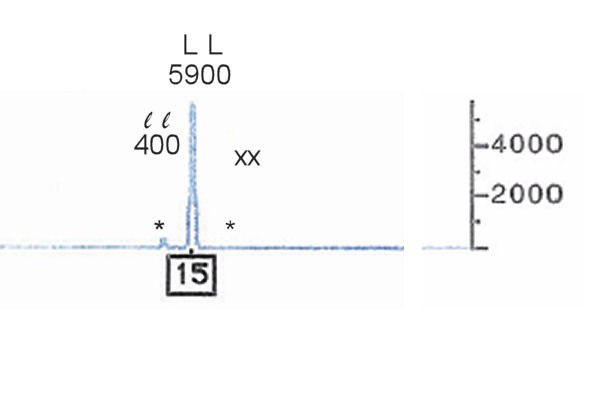
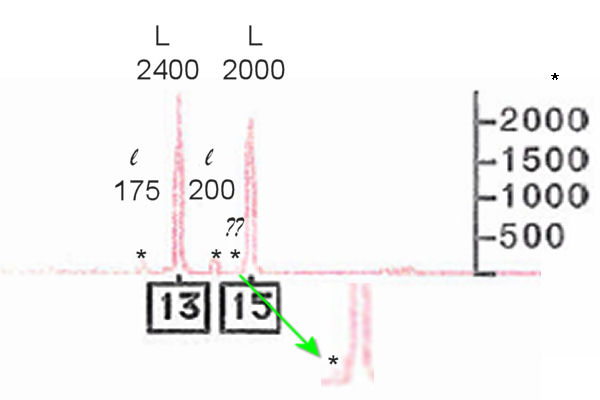
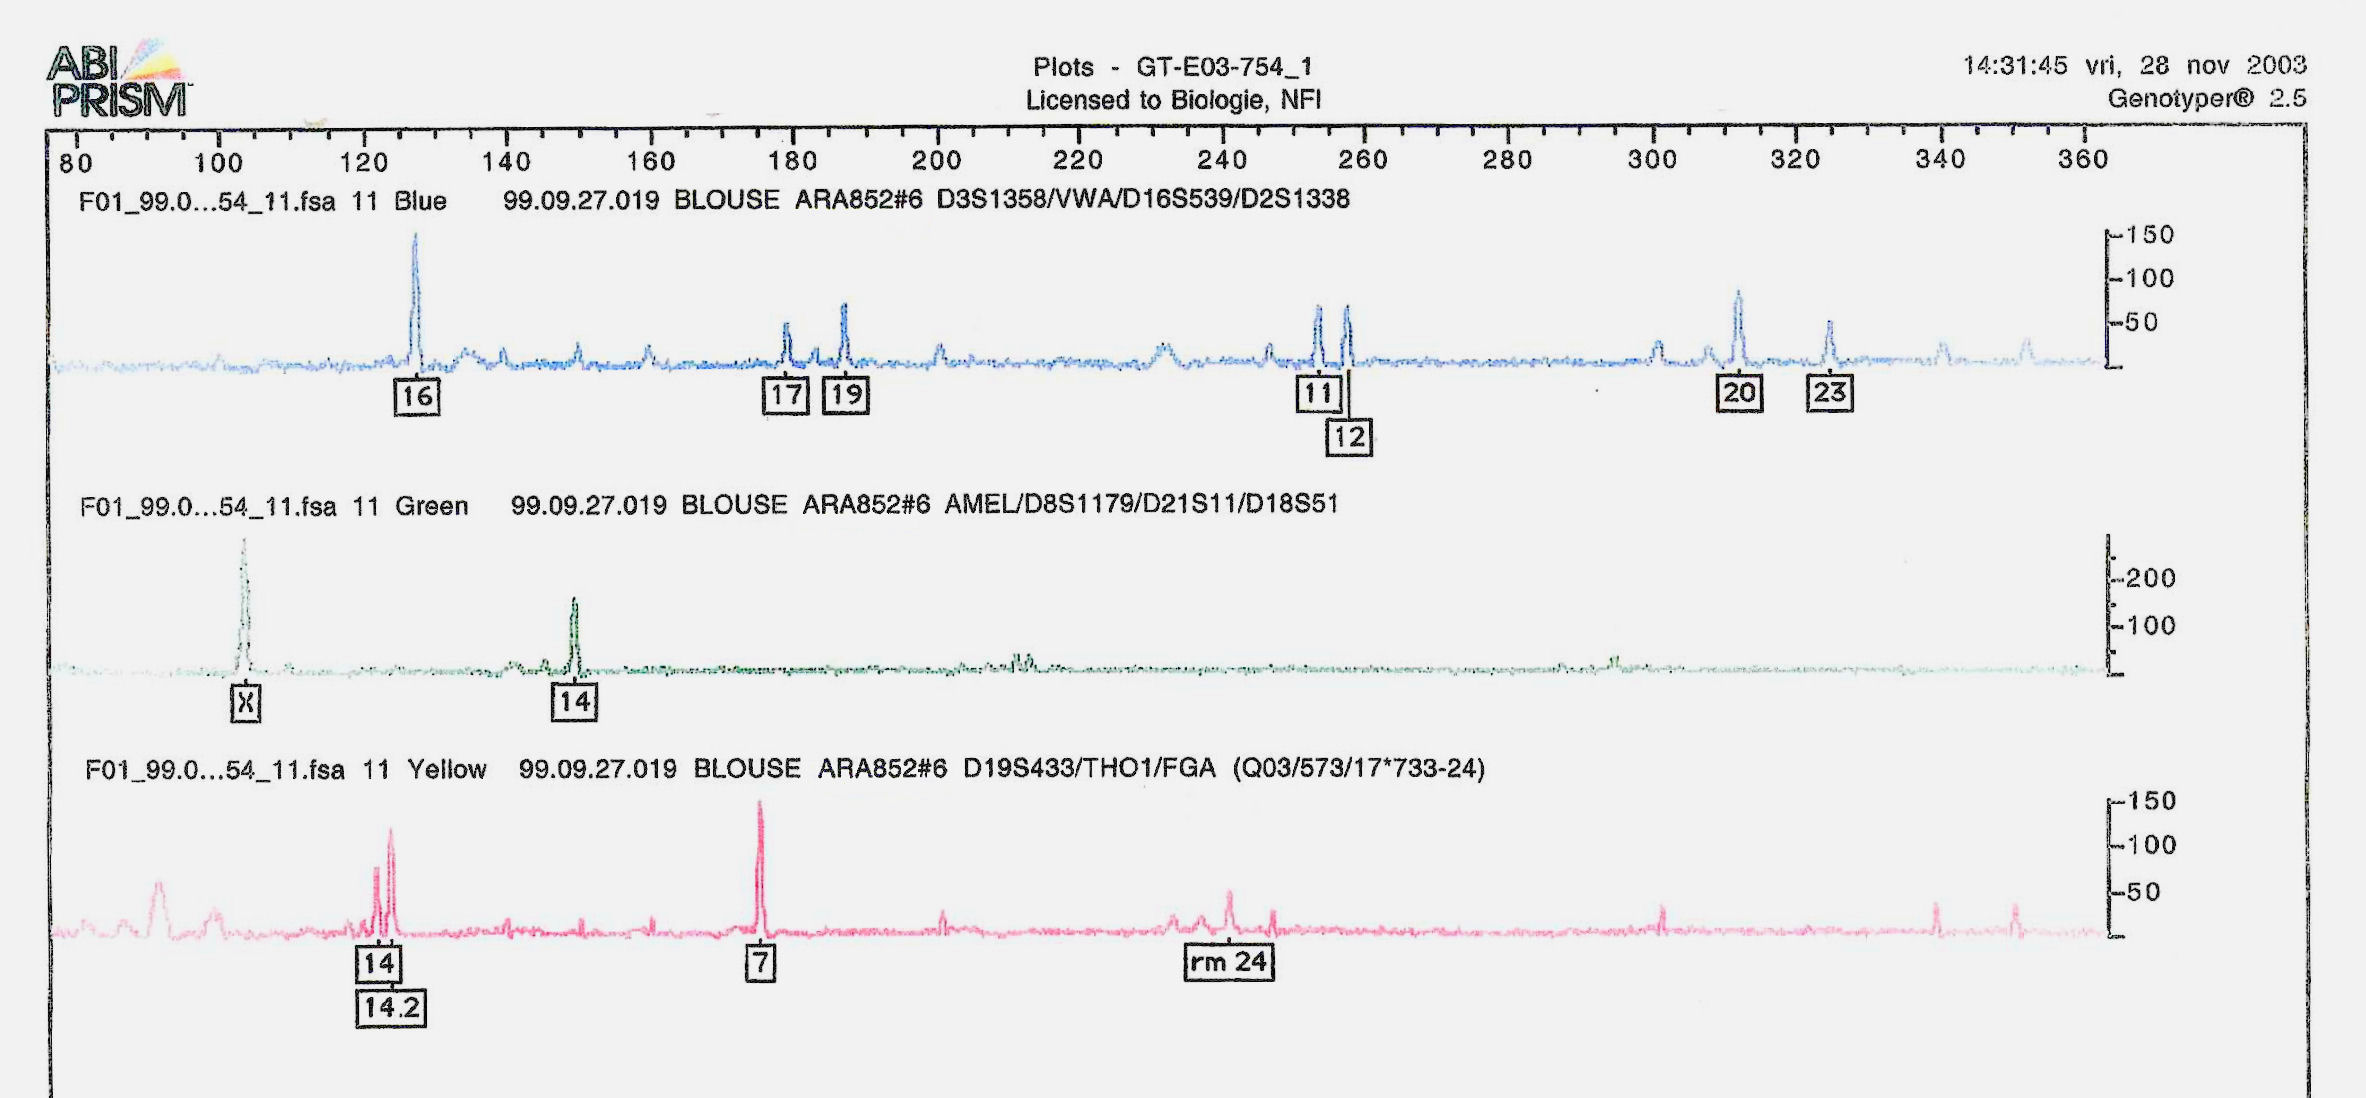
Trace #10 reveils a true allele of W16W16 on
the forward
stutterposite 16 of LL15. Forward stutters most of the
time are extremely low, too low to explain the added peak.
Correctly the NFI marked the peak but omitted this from the
subsequent report. |
|
VWA |
|
|
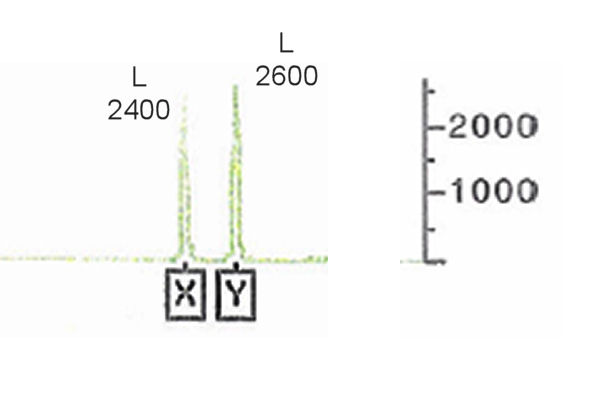
Imbalance. Locus VWA17 in trace #10 increased proportionally compared to the reference profile due to W17. The balance is overtrown. W19 is invisible (drop-out). |
|
Locus en referentiesporen |
reference Louwes |
trace #10 |
comparisons |
|
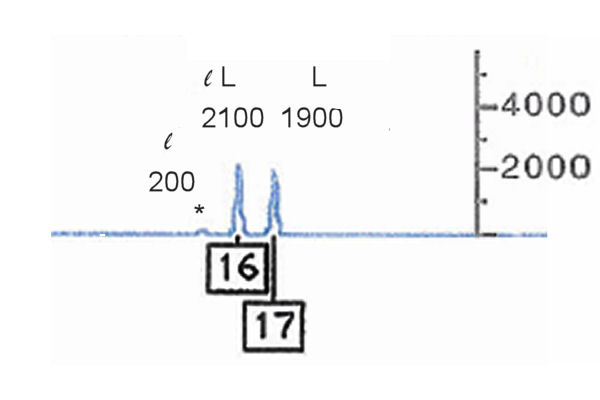
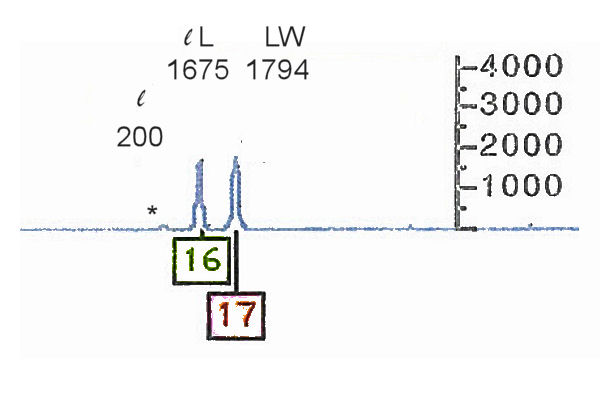
D16 |
|
|
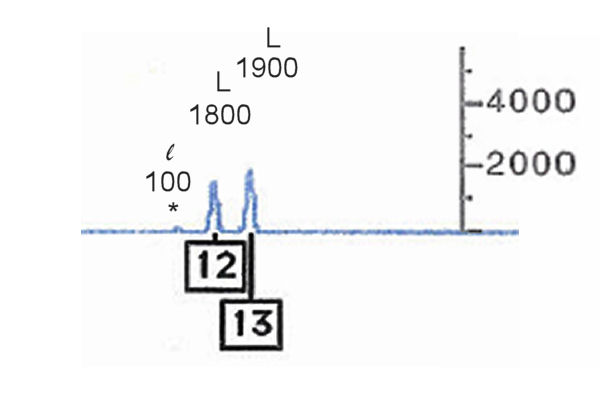
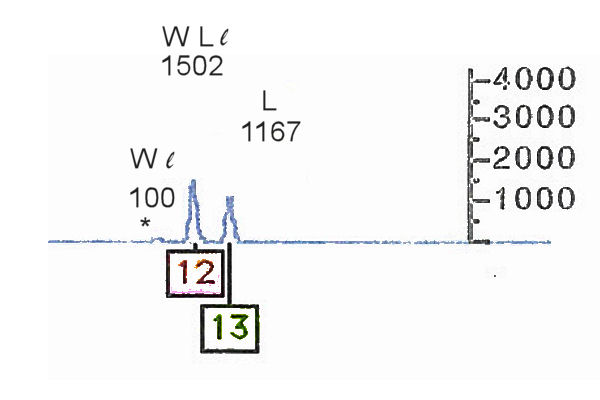
Here both contributions W11 and W12 are visible. W11 increased the backward stutter l11 above the threshold. At the same time W12 overthrew the imbalance L12-L13. |
|
D2 |
|
|
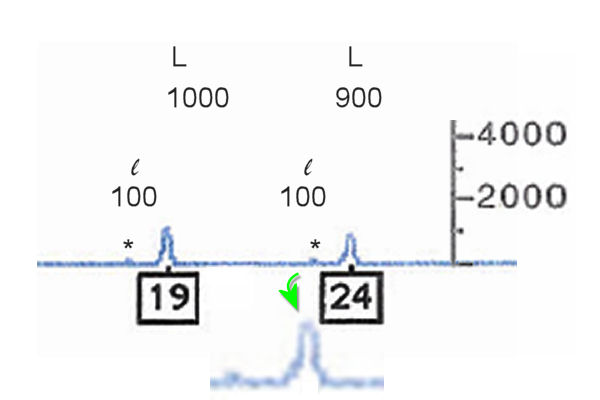
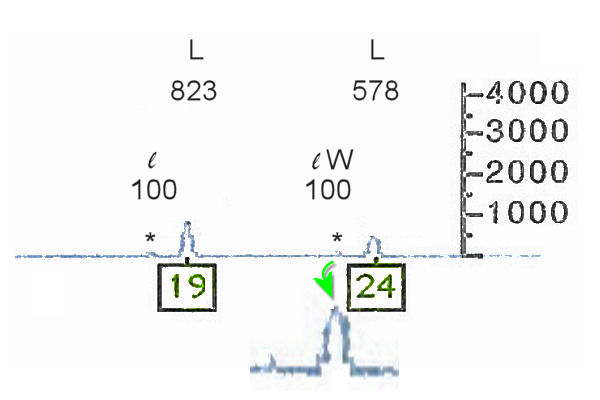
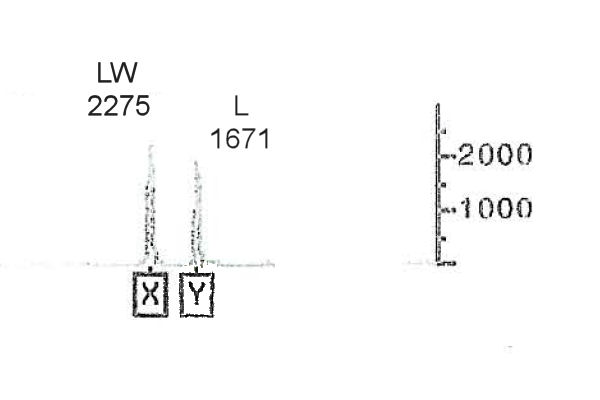
W20 is invisible (drop-out), W23 might contrbute to l23, which increased in height and rose above the stutter threshold. Note, the current imbalance was not overthrown. There was no reason to expect so. |
|
Locus and references |
reference Louwes |
trace #10 |
comparisons |
|
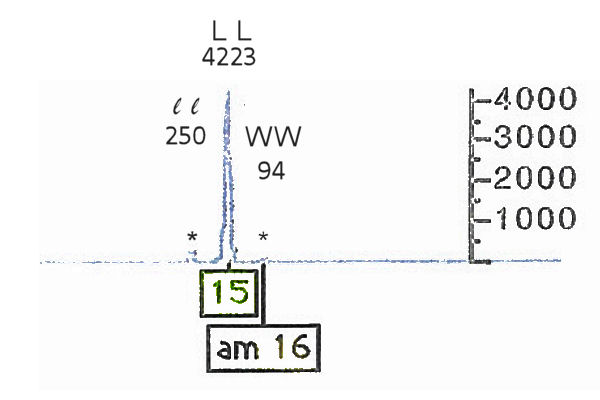
AmelXY |
|
|
Here the imbalance
is overthrown significantly possibly because of the
added contribution of XX from the DNA of W. |
|
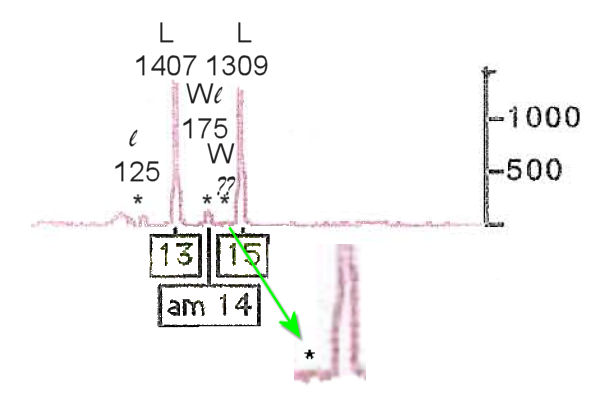
D8 |
|
|
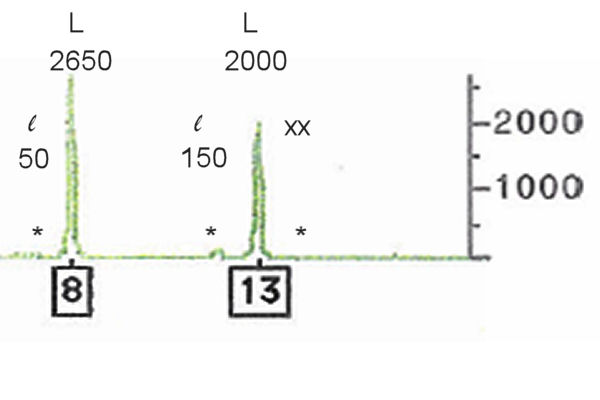
The true allel W14W14 is visible and marked in the position of the forward stutter l14 van L13, exceeding the threshold by far. |
|
Locus and references |
reference Louwes |
trace #10 |
comparisons |
|
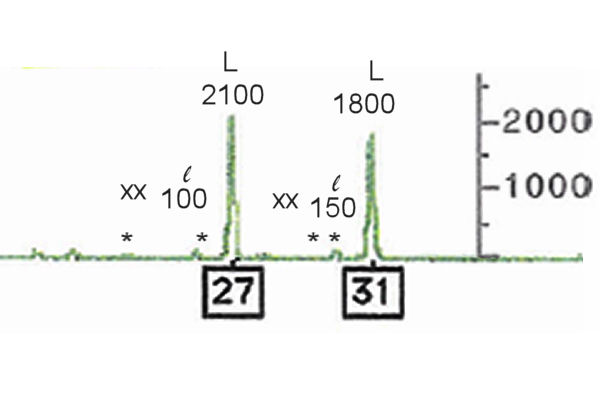
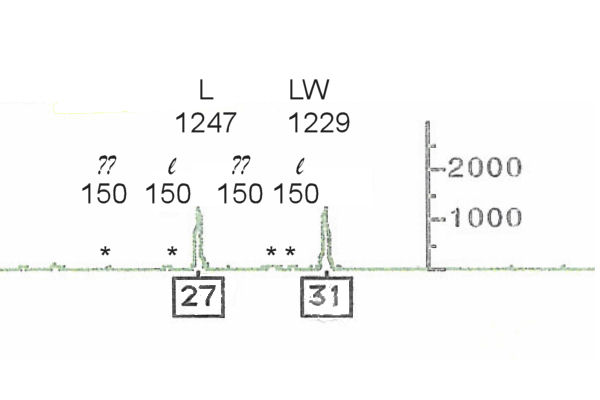
D21 l 26 30 |
|
|
The imbalance of L27 and L31 is almost levelled, possible under the influence of W31. In addition some irregularities remain unexplained (24 and 29.2). W 31.2 appears invisible (drop-out). |
|
D18 |
|
|
W15 seems to be visible. Furthermore a small peak in both profiles (18) remains unexplained (contamination?). |
|
Locus and references |
reference Louwes |
trace #10 |
comparisons |
|
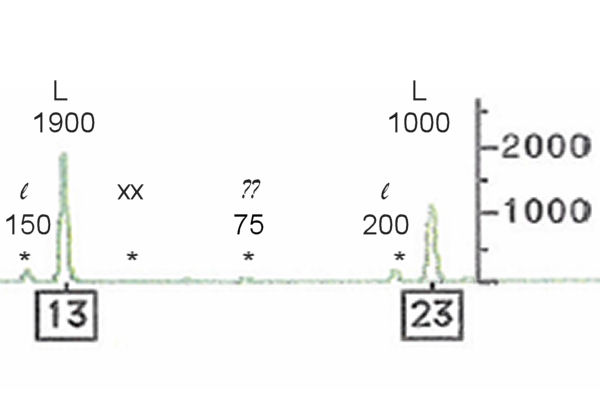
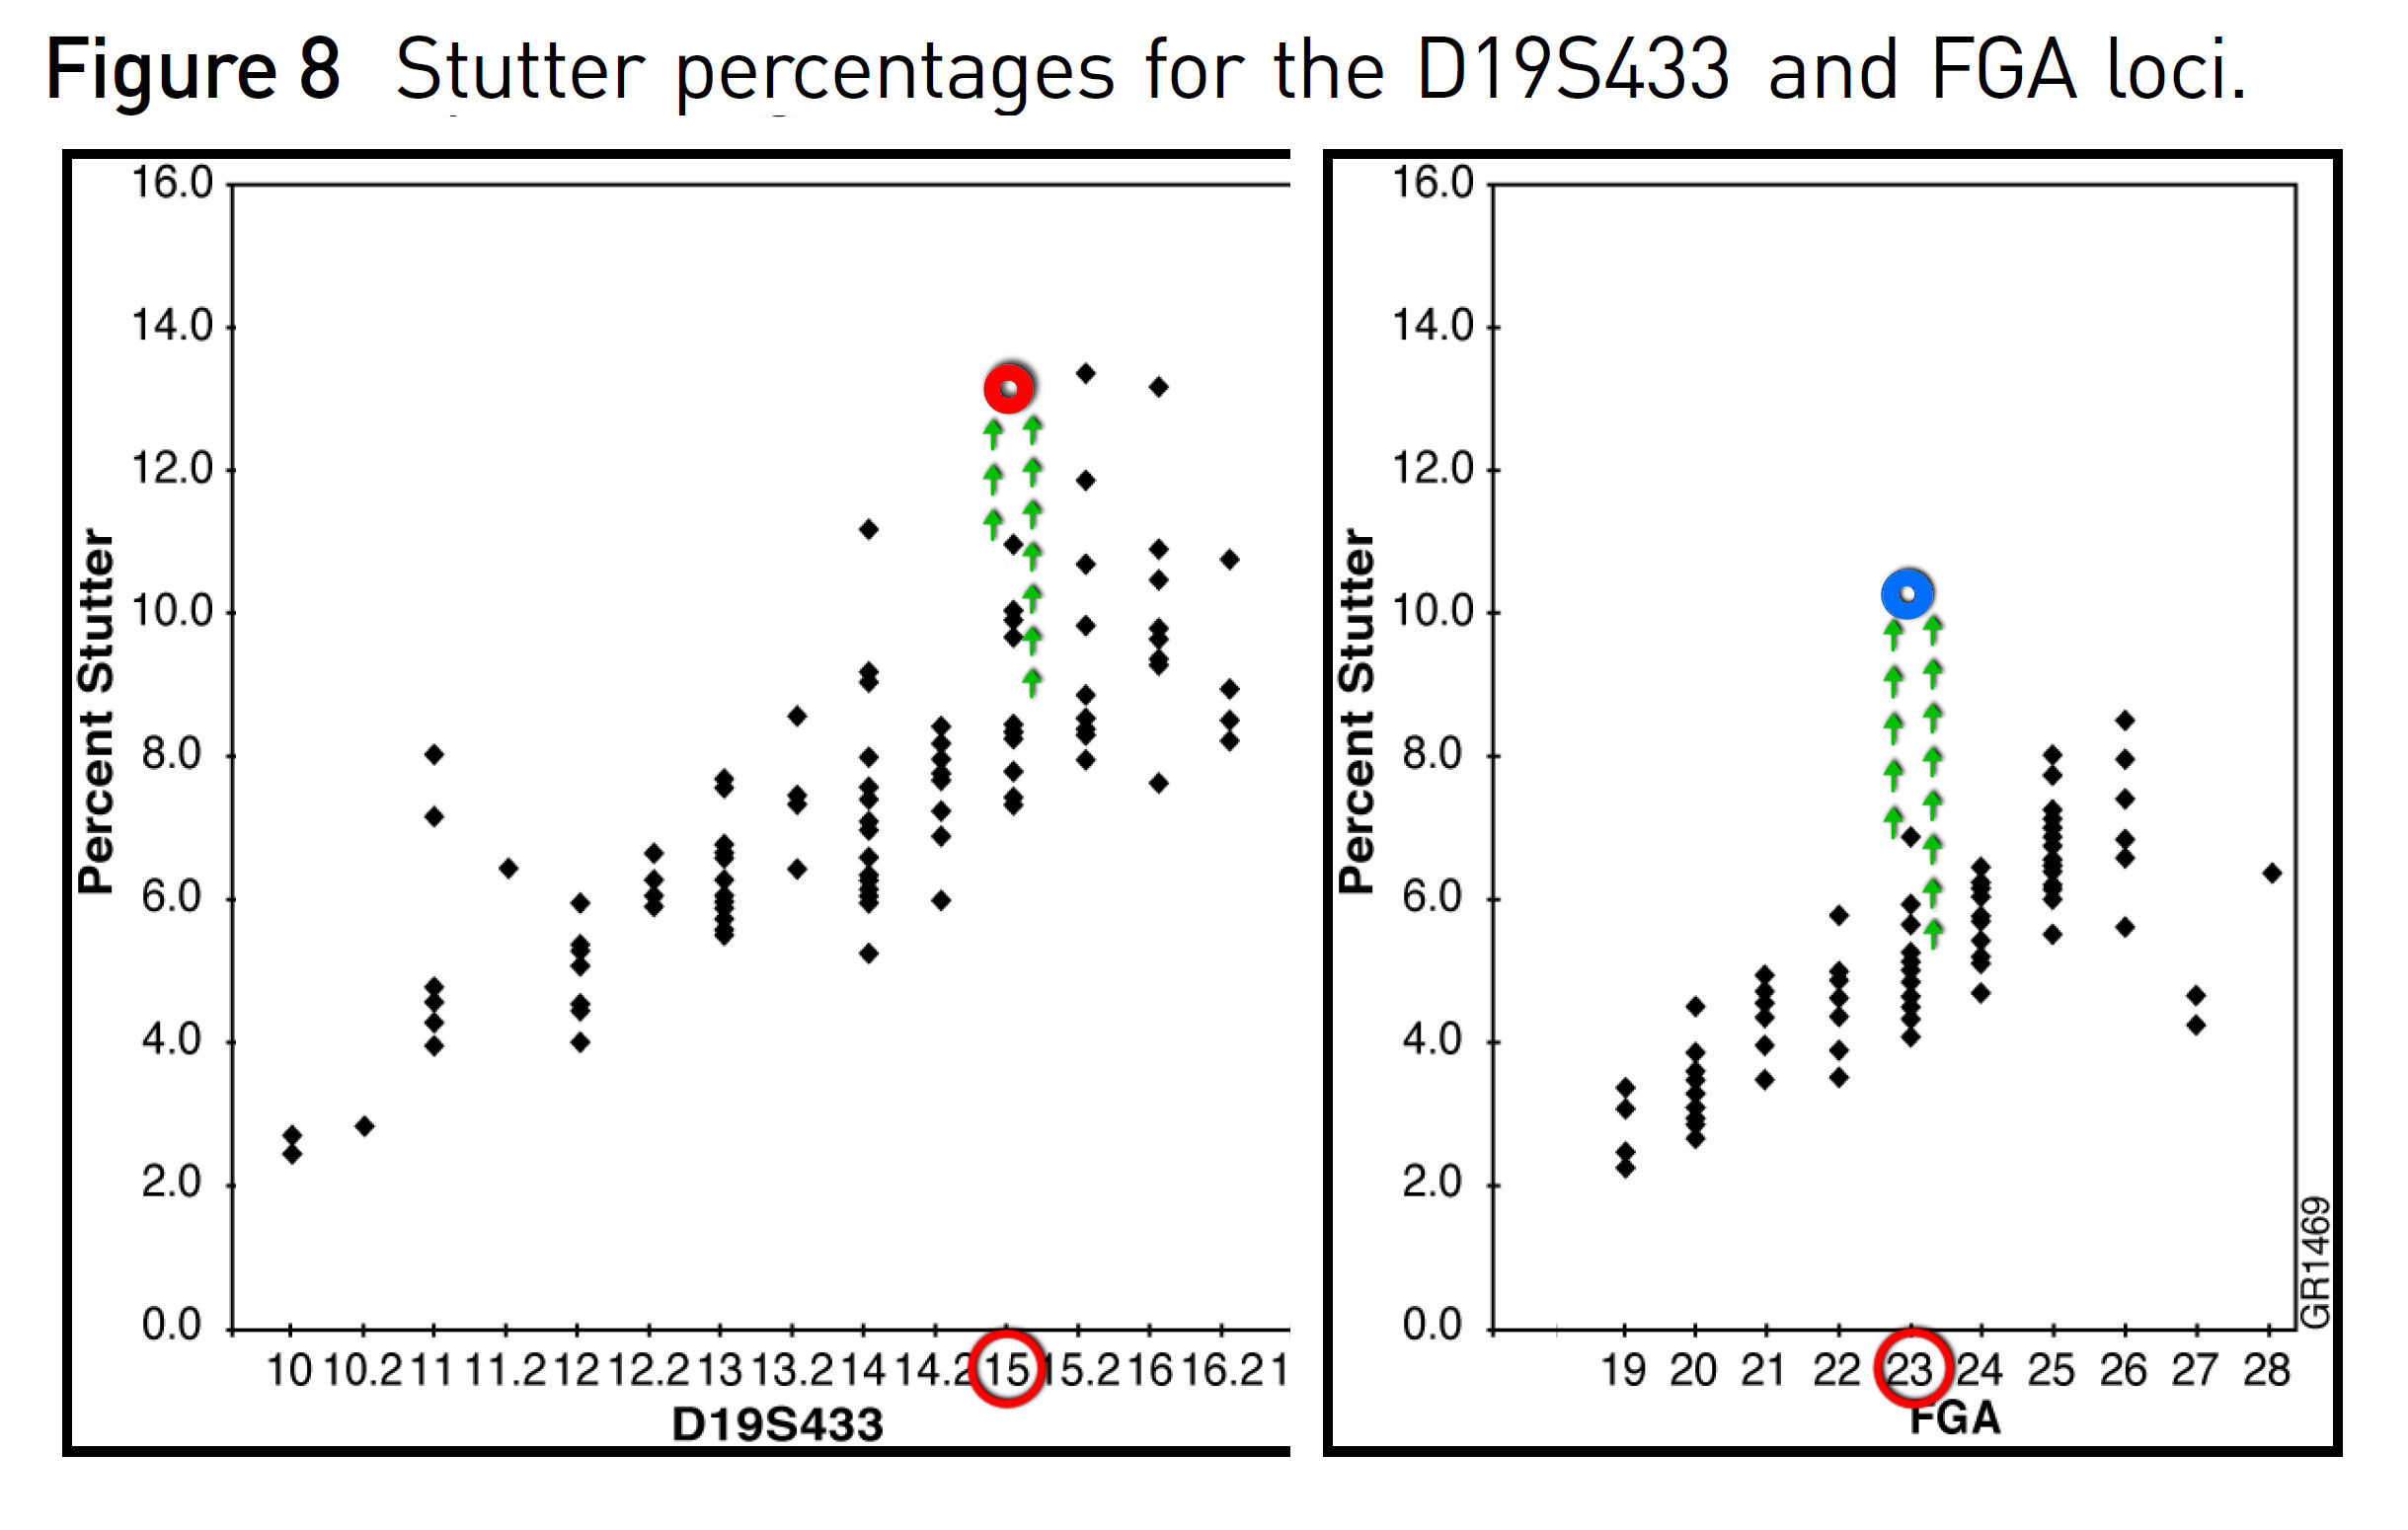
D19 l 12 14 |
|
|
Contributions of W might be visible at 14 and 14.2 At 14 the heigt of the stutter increased significantly (from 10 % to 13% exceeding the stutter threshold l14). In both profiles tiny irregularities at 14.2. |
|
THO1 |
|
|
A marginal overthrow in imbalance is visible in agreement with a contribution of W7 W7. Stutters are not relevant and also very low. |
|
Locus and references |
reference Louwes |
trace #10 |
comparisons |
|
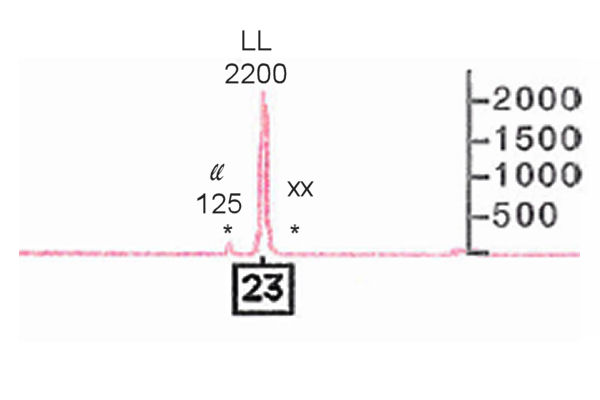
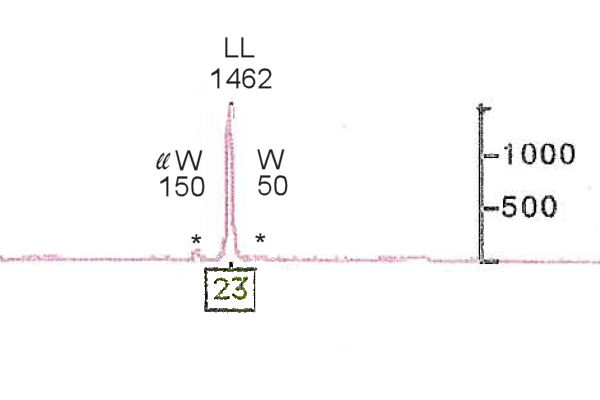
FGA l 22 22 W 22 24 |
|
|
The contribution W22 is potentially the cause of the increase of stutter l22 22, now exceeding the stutter threshold. Possibly there is a peak at 24 (W24), but this is very unclear. |
| Legenda | |
| * | peak with low RFU in trace#10( with a similar marker in the reference profile). |
| l |
to point at stutter peaks of Louwes. Because the RFU-values of the stutters in the profile of the victim are expected to be extremely low, they are ignored. |
| L | true alleles of Louwes. |
| W | true alleles of the victim Wittenberg. |
| xx | peak visible in trace 10 but lacking in the reference of Louwes. |
 |
Comparing trace #10 to the reference profile of Louwes
reveals a number of differences, which can be used to
construct a new electropherogram. In five positions no trace
of the victim is visible, just in several other profiles of
the victim in the file of the Deventer Murder Case. The presence of traces at other positions justify the position that the presence of DNA of the victim in trace #10 cannot be excluded. So trace #10 is a mixed profile and therefor it is possible that the blood spot visible in trace #10 originates from the victim. This is in agreement with the evaluation of the peak heights involved as demonstrated in the paragraph calculations. |
 |
The electropherogram of trace #06 exhibits a comparable
set of peaks of comparable heights. This trace was considered
a partial profile of the victim on base of a frequency of less
than 1 out of billion (NFI report 5 december 2003). In
11 or 12 positions (out of 17) it matches her reference
profile, so largely in agreement with the reconstructed
profile aforementioned. |
Another approach is the following. We might compare all peaks and tiny peaks in trace #10 to the reference profile of Louwes and calculate the measure of correlation. Of cource, the agreement will be strong, trace #10 consist in both hypothesis of the defence and the procecutor largely or completely of DNA of Louwes:
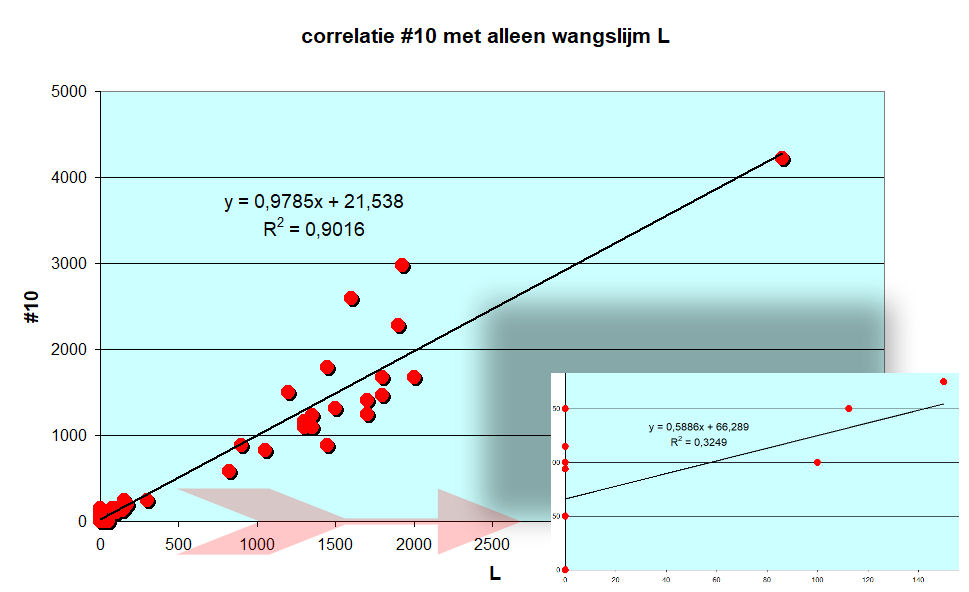 |
| Horizontal: peak
heights in the mean reference profile of Louwes (there are two
replicates). Vertical: matching peak heights in the profile of
trace #10. Correlation according the R-squared value is very
high (mximum is 1). When fossusing on the lowest peaks - see
inset picture - the R-squared value is very low in
contrast. |
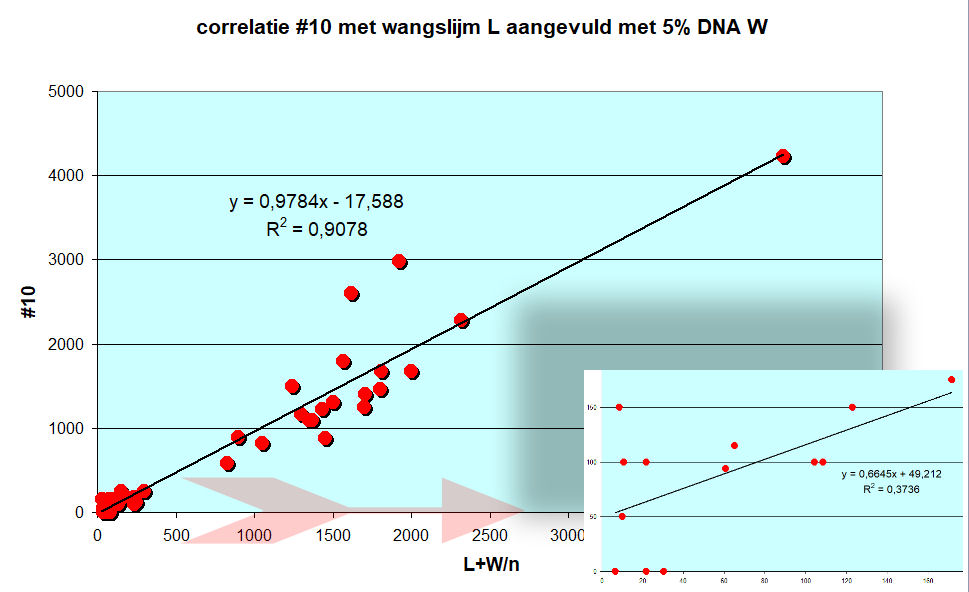 |
| Horizontal: peak
heights in a mixed profile of Louwes with an addition of 5%
profile of the victim. Vertical again peak heights in trace
#10. The R-squares values are higher, notably in the lower
quadrant. |
 |
 |
| Four
peaks - matching with the profile of he victim -connected
(combined with) to backward stutters exhibit peak heights
surpassing easely peak heights measured during validation of
yhe used SGMPlus system as shown in the manual of the kit as
well in comparison with the medians as with their maxima. In
comparison with the mean values, this peak heights in trace 10
are 4 to 9% higher, in agreement with the estimate of 5% of
DNA of the victim in trace #10. |
|
 |
|
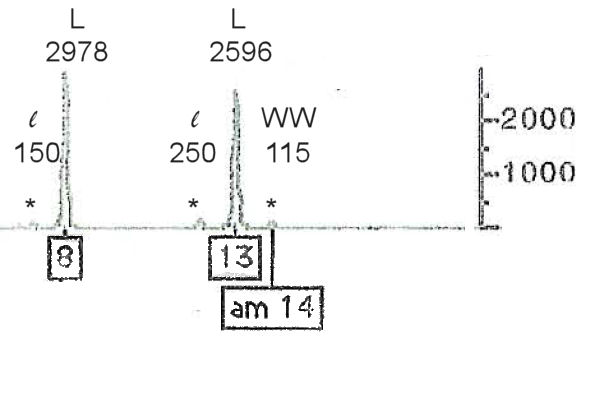
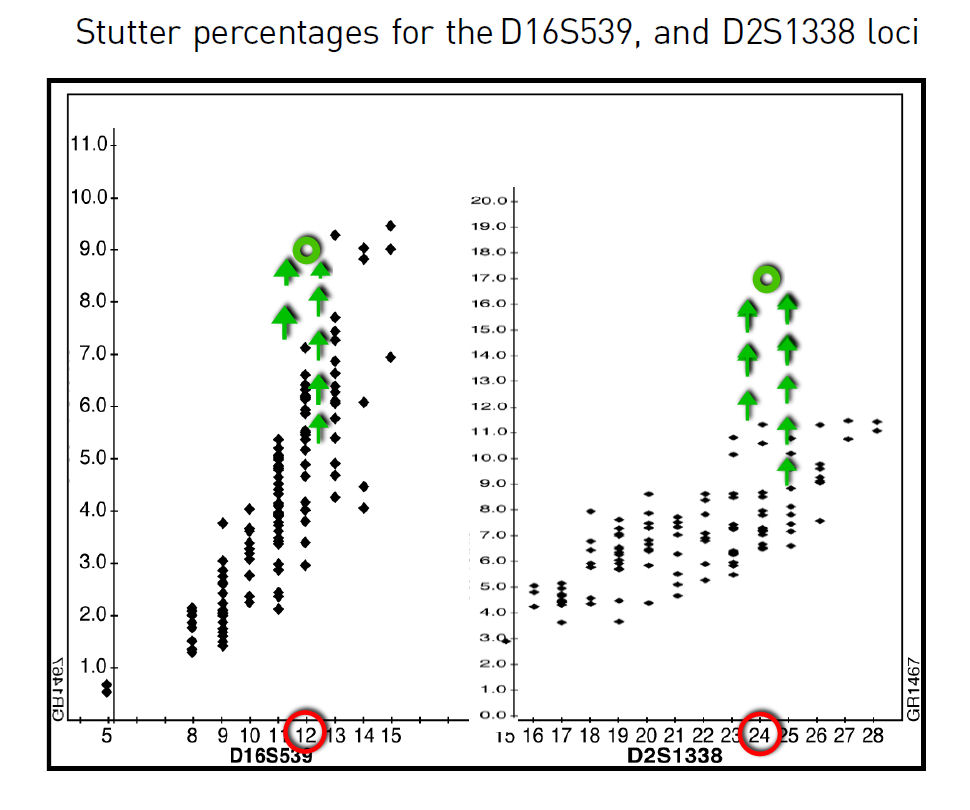
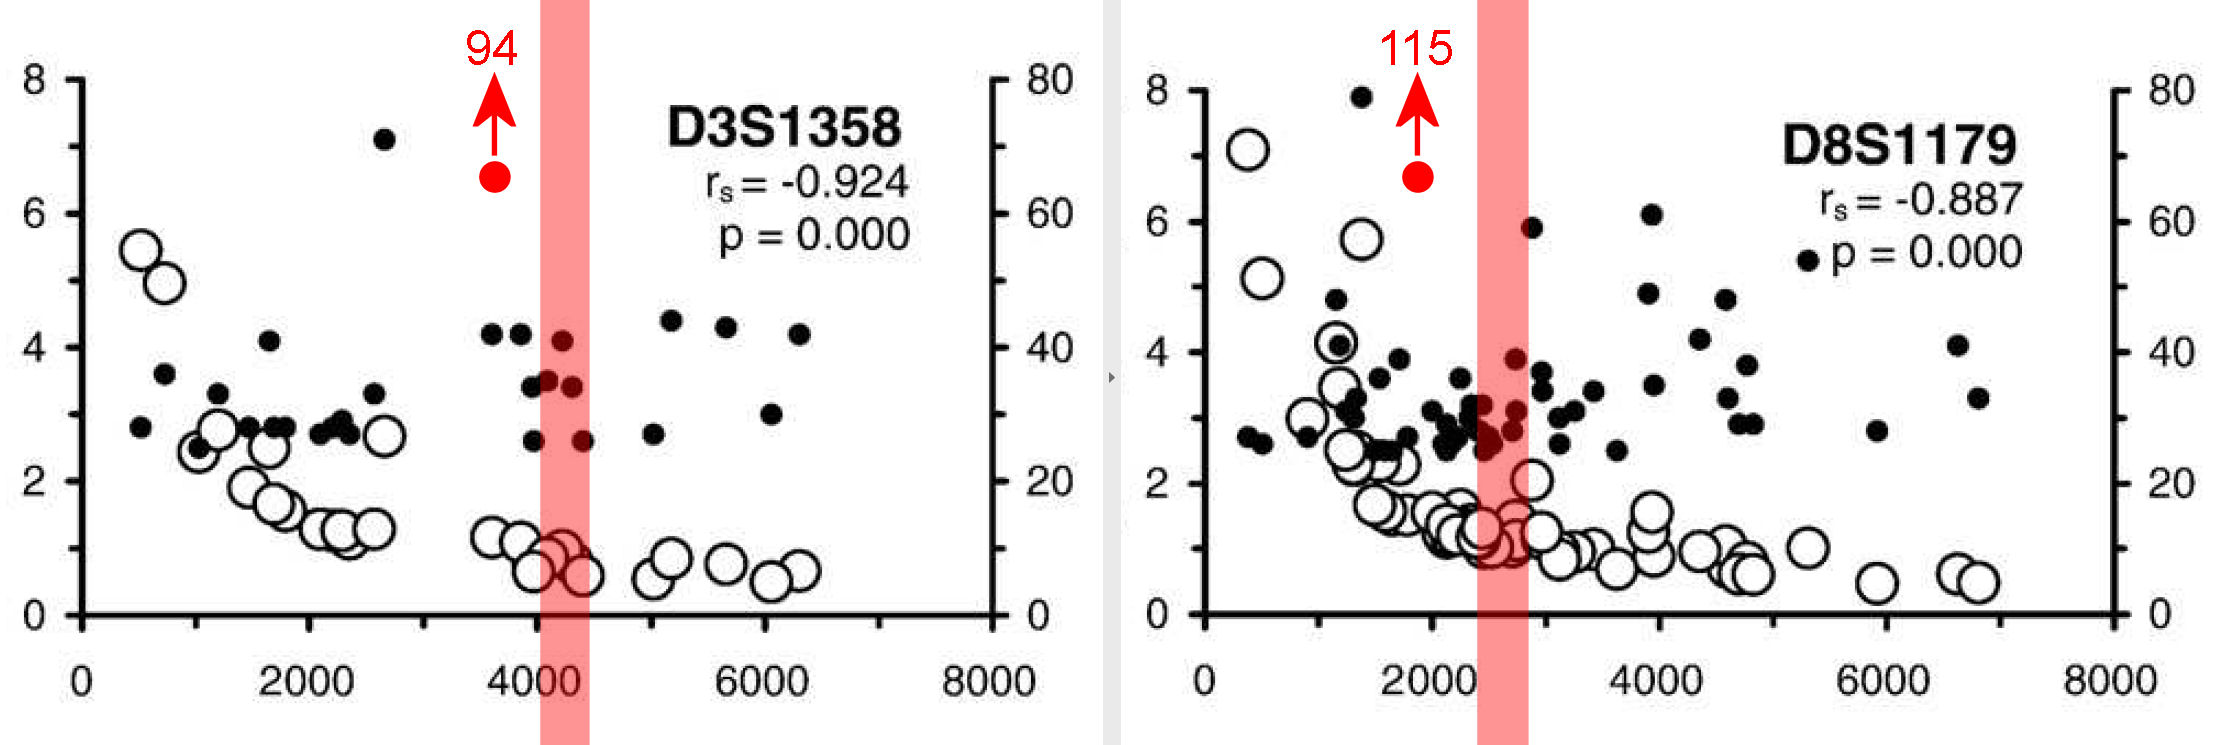
| The forward stutter in D3 has a maximum of 1% hoog (open circles), or RFU 40 (solid circles) where a match with the victim is suspected (red vertical line). In trace#10 we see een peak height of 94 RFU or 2,2%, so double in height. This peak matches with the profile of the victim, with a homozygotic peak notably. | This forward stutter in D8 has a maximum of 2% or 40 RFU. In trace #10 we find a peak height of RFU 115, or 4,4%, again twice in height. Again matching to a homozygotic peak in the victim's profile. |
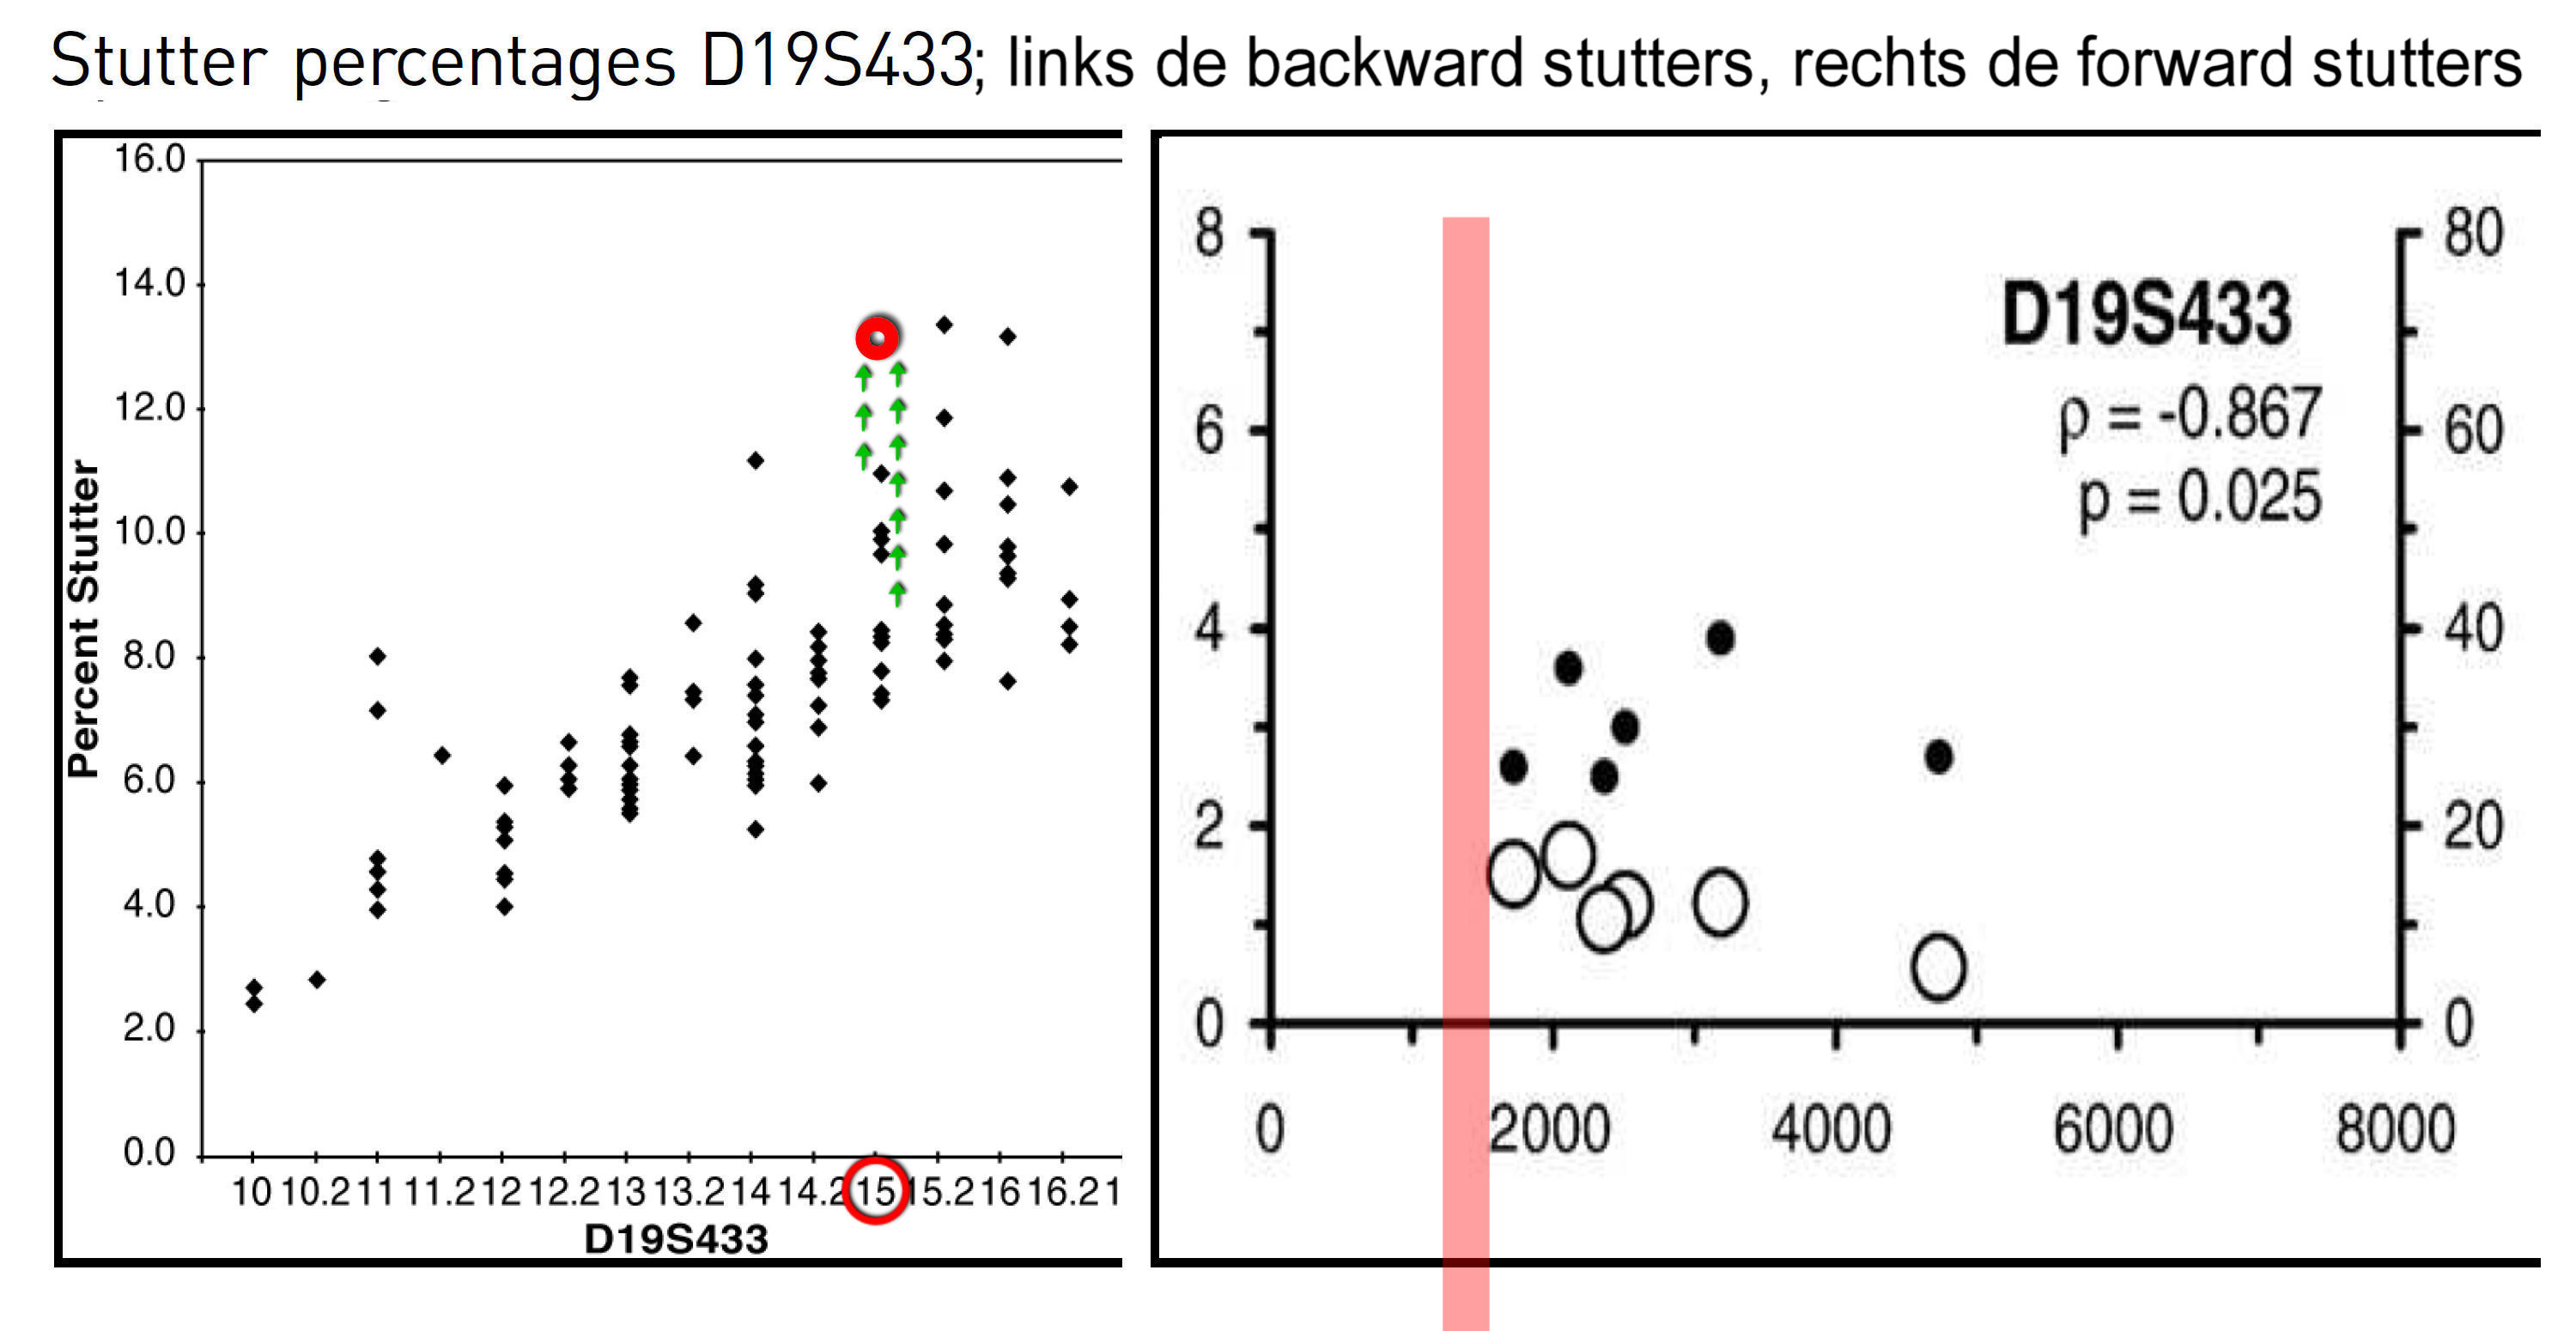 |
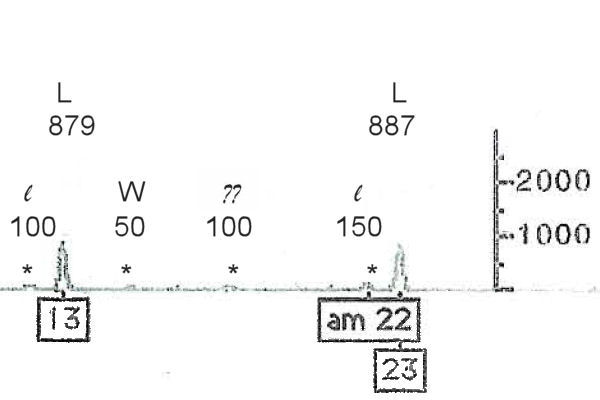
| Peak 14 in locus D19 is
special, being a forward stutter of L13 and a backward stutter
van L15. De backward stutter should be on average 8% of the
parent with RFU 1309 amounting to 105 RFU. De forward stutter
contributes about 30 RFU. In reallty the peak measures 173
RFU, so 40 RFU higher. |
 The amount of shift is expressed
in proportion to the standard deviation measured during the
validation. Based on a normal distribution, a shift of 2 x SD
shifts a value from the centre of the distribution to a zone
with 2,5% probability (it being coincidental). Because the
definition of PHR is rather peculiar, the distribution is
possibly not normal, but in some cases , the shift is far more
than 2 x SD and might be considered significant nevertheless. The amount of shift is expressed
in proportion to the standard deviation measured during the
validation. Based on a normal distribution, a shift of 2 x SD
shifts a value from the centre of the distribution to a zone
with 2,5% probability (it being coincidental). Because the
definition of PHR is rather peculiar, the distribution is
possibly not normal, but in some cases , the shift is far more
than 2 x SD and might be considered significant nevertheless. |
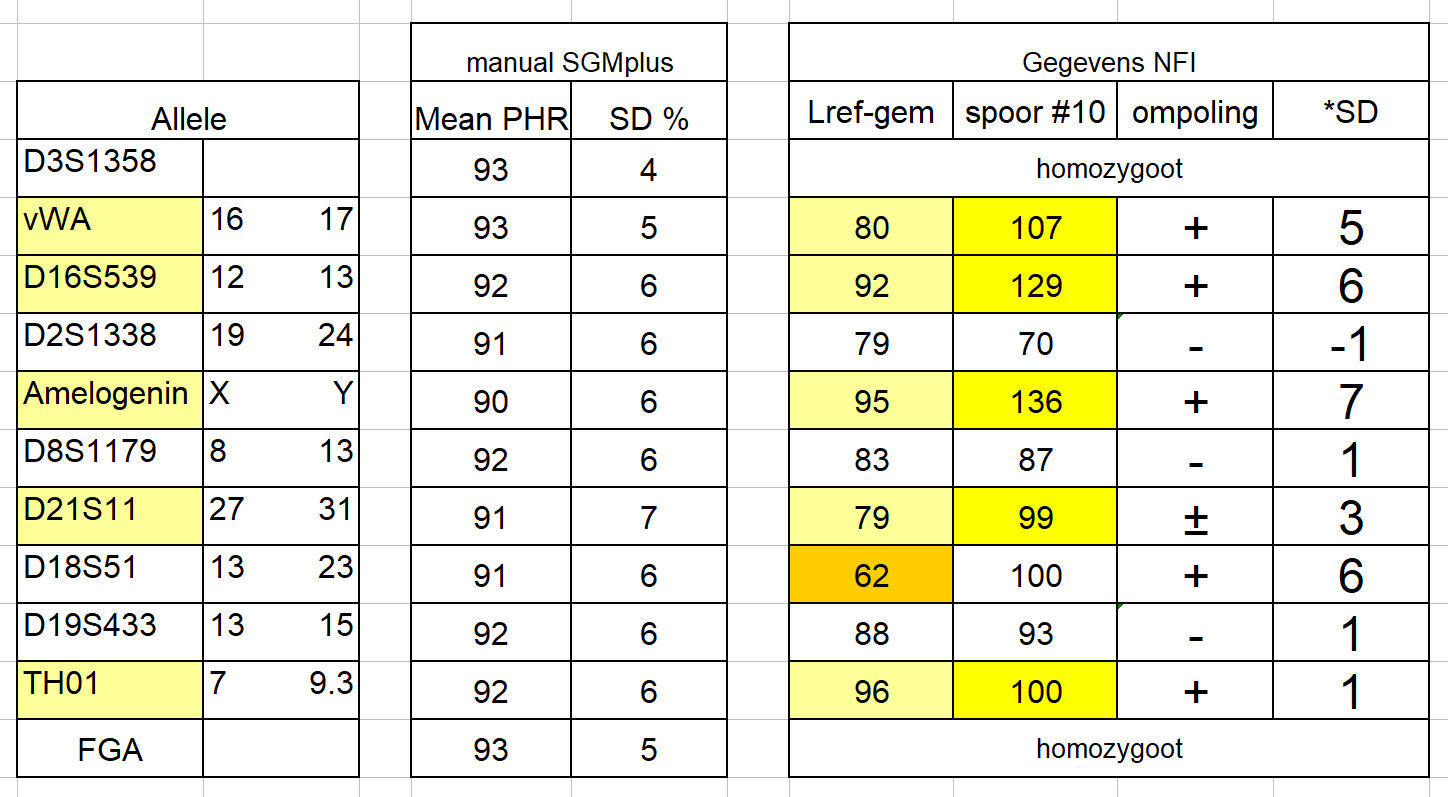
Most
loci are filled with two prominent peaks of Louwes
(heterozygous and XY-amel). Exceptions ('homozygoot' ) are
indicated. Originally both peaks ought to be of the same
height. In reality, there is always a difference; the column
PHR (Peak Height Ratio) shows the most probable imbalance
based on a number of validation experiments (50 - 100) by the
manufacturer of the SGMPlus kit, which was in use at the NFI.
There is no mention of the fact which peak was higher, the
left or the right one. Using data of the NFI, the PHR's of the
mean reference sample of Louwes was calculated. The value of
D18S51 deviates strongly and has to be left out of the picture
(but observe the huge interval between the two peaks). In this
case without consequences, an extra imbalance is not to be
expected, because there is no overlap between L and W at this
locus. Where an imbalance is to be expected, the data are
marked yellow. The column 'spoor #10' shows the new PHR,
complying to the original sequence of the PHR. The suspected
addition of DNA-STR's from the profile of the victim led
almost everywhere to a reversion of polarity; the smallest
peak of the couple almost everywhere switched to be the
largest. By chance the addition is almost every instance
combined with the smallest peak of the couple so the change
afterwards gets very clear. 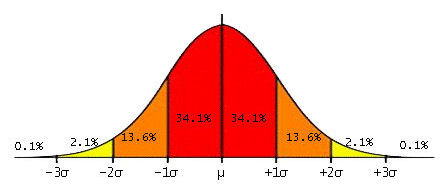 |